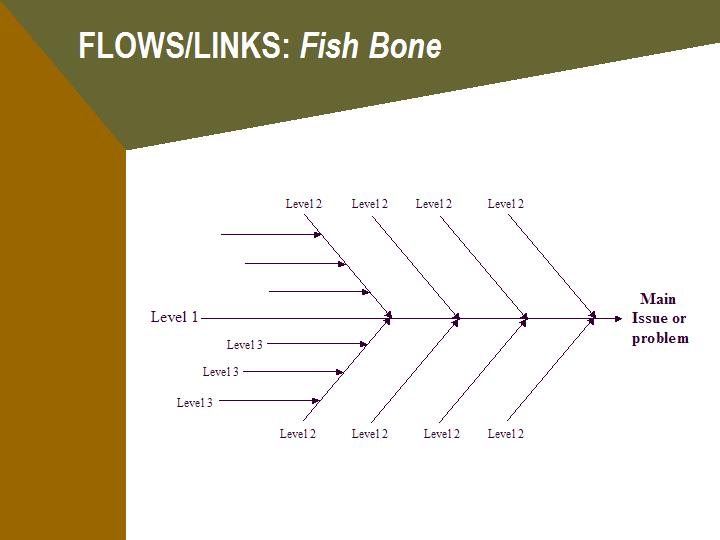
An end result or eventual outcome may have several issues that impact on it. A fish-bone diagram enables the listing of causes or issues as Level 1, Level 2 , Level 3 or more, where Level 1 is the main cause, level 2 issues impact on or create the Level 1 problem, etc.
Sometimes a tree is also used to illustrate the flow of issues/topics, albeit in the reverse direction! The trunk (I.e. the main problem or issue) is the starting point for a numbe rof branches and sub-branches (i.e. impacts/effects) to grow out. 'Family trees' are a good example of this approach.
A second way to illustrate links is by using a fish-bone diagram – so called because of its resemblance to the bone structure of a fish. It is a good way to illustrate cause-effect relationships.
Return to theme Page |